QuantLearn
Trading Strategies
RSI Pattern Recognition
Relative strength index with pattern analysis
Historical Backtest Results
Backtesting results comparing RSI pattern recognition against traditional RSI threshold trading across multiple market conditions.

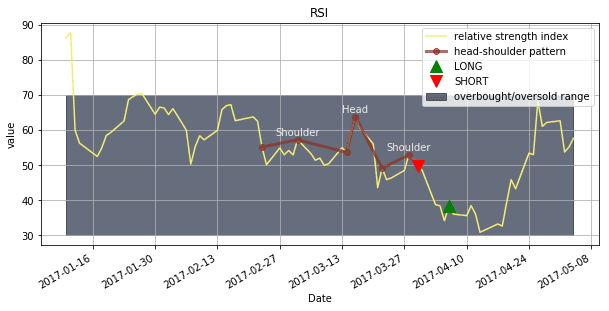
RSI Pattern Recognition Positions
Trading positions based on head-and-shoulders patterns detected within RSI oscillator, showing entry and exit points.

RSI Oscillator with Patterns
RSI oscillator chart highlighting identified head-and-shoulders patterns with peak/trough analysis and pattern scoring.
Strategy Performance Comparison
Performance comparison between RSI pattern recognition and traditional RSI overbought/oversold strategy over extended backtest period.
RSI Momentum and Pattern Analysis
RSI (Relative Strength Index) measures the speed and magnitude of price momentum changes on a 0-100 scale.
Traditional RSI trading uses simple overbought (>70) and oversold (<30) levels, but this approach often generates false signals.
Pattern recognition on RSI oscillator itself provides more sophisticated entry signals than basic threshold trading.
Head-and-shoulders pattern in RSI indicates momentum exhaustion and potential trend reversal points.
Unlike price-based patterns, RSI patterns filter out market noise and focus purely on momentum dynamics.
This approach was pioneered by Welles Wilder, who created both RSI and Parabolic SAR indicators.
The strategy combines quantitative oscillator analysis with qualitative pattern recognition for enhanced signal accuracy.
Mathematical Foundation
1Relative Strength Index
RSI formula where RS is the average gain divided by average loss over the specified period (typically 14 days).
2Relative Strength (RS)
Relative strength calculated using exponential moving averages of gains and losses over n periods.
3Smoothed Moving Average
Wilder's smoothing method for calculating RSI components, providing more stable oscillator values.
4Head-and-Shoulders Pattern Score
Quantitative pattern recognition score combining height ratios, shoulder symmetry, and volume confirmation.
Core Algorithm Implementation
The RSI pattern recognition algorithm calculates RSI values and identifies head-and-shoulders patterns within the oscillator itself.
RSI Calculation with Wilder Smoothing
def calculate_rsi(prices, period=14):
    """Calculate RSI using Wilder's original smoothing method"""
    delta = prices.diff()
    gain = delta.where(delta > 0, 0)
    loss = -delta.where(delta < 0, 0)

    # Initial average gain and loss
    avg_gain = gain.rolling(window=period).mean()
    avg_loss = loss.rolling(window=period).mean()

    # Wilder's smoothing for subsequent values
    for i in range(period, len(gain)):
        avg_gain.iloc[i] = (avg_gain.iloc[i-1] * (period-1) + gain.iloc[i]) / period
        avg_loss.iloc[i] = (avg_loss.iloc[i-1] * (period-1) + loss.iloc[i]) / period

    rs = avg_gain / avg_loss
    rsi = 100 - (100 / (1 + rs))

    return rsi
Implements Wilder's original RSI calculation with proper smoothing methodology for accurate momentum measurement.
Pattern Recognition - Peak/Trough Detection
def find_peaks_troughs(rsi, window=5, min_distance=10):
    """Identify significant peaks and troughs in RSI for pattern analysis"""
    from scipy.signal import find_peaks, find_peaks_cwt

    # Find peaks (local maxima)
    peaks, peak_properties = find_peaks(
        rsi,
        distance=min_distance,
        prominence=5,  # Minimum prominence for significant peaks
        width=3        # Minimum peak width
    )

    # Find troughs (local minima) by inverting RSI
    troughs, trough_properties = find_peaks(
        -rsi,
        distance=min_distance,
        prominence=5,
        width=3
    )

    # Create pattern dataframe
    pattern_df = pd.DataFrame({
        'peaks': peaks,
        'peak_values': rsi.iloc[peaks].values,
        'troughs': troughs,
        'trough_values': rsi.iloc[troughs].values
    })

    return peaks, troughs, pattern_df
Uses signal processing techniques to identify significant peaks and troughs in RSI for pattern construction.
Head-and-Shoulders Pattern Detection
def detect_head_shoulders_rsi(rsi, peaks, min_head_height=70, max_shoulder_height=65):
    """Detect head-and-shoulders patterns within RSI oscillator"""
    patterns = []

    for i in range(2, len(peaks)):
        # Get three consecutive peaks
        left_shoulder = peaks[i-2]
        head = peaks[i-1]
        right_shoulder = peaks[i]

        ls_value = rsi.iloc[left_shoulder]
        head_value = rsi.iloc[head]
        rs_value = rsi.iloc[right_shoulder]

        # Head-and-shoulders criteria
        conditions = [
            head_value > min_head_height,  # Head in overbought zone
            head_value > ls_value,         # Head higher than left shoulder
            head_value > rs_value,         # Head higher than right shoulder
            abs(ls_value - rs_value) < 10, # Shoulders roughly equal
            ls_value < max_shoulder_height, # Shoulders not too high
            rs_value < max_shoulder_height
        ]

        if all(conditions):
            # Calculate pattern strength
            head_prominence = head_value - max(ls_value, rs_value)
            shoulder_symmetry = 1 - abs(ls_value - rs_value) / max(ls_value, rs_value)

            pattern_score = head_prominence * shoulder_symmetry

            patterns.append({
                'left_shoulder_idx': left_shoulder,
                'head_idx': head,
                'right_shoulder_idx': right_shoulder,
                'left_shoulder_rsi': ls_value,
                'head_rsi': head_value,
                'right_shoulder_rsi': rs_value,
                'pattern_score': pattern_score,
                'signal_type': 'bearish_reversal'
            })

    return patterns
Sophisticated pattern recognition algorithm that identifies head-and-shoulders formations in RSI with scoring system.
Signal Generation and Trade Execution
def generate_rsi_pattern_signals(df, rsi_period=14):
    """Complete RSI pattern recognition trading system"""
    df = df.copy()

    # Calculate RSI
    df['rsi'] = calculate_rsi(df['Close'], rsi_period)

    # Find peaks and troughs
    peaks, troughs, _ = find_peaks_troughs(df['rsi'])

    # Detect head-and-shoulders patterns
    hs_patterns = detect_head_shoulders_rsi(df['rsi'], peaks)

    # Generate signals
    df['signal'] = 0
    df['pattern_strength'] = 0

    for pattern in hs_patterns:
        signal_idx = pattern['right_shoulder_idx']

        # Bearish signal after completing head-and-shoulders
        if pattern['signal_type'] == 'bearish_reversal':
            df.loc[df.index[signal_idx], 'signal'] = -1
            df.loc[df.index[signal_idx], 'pattern_strength'] = pattern['pattern_score']

    # Add exit signals based on RSI levels
    df['position'] = df['signal'].replace(0, np.nan).fillna(method='ffill').fillna(0)

    # Exit long positions when RSI drops below 30 (oversold)
    exit_long = (df['position'] == 1) & (df['rsi'] < 30)
    df.loc[exit_long, 'signal'] = -1

    # Exit short positions when RSI rises above 70 (overbought)
    exit_short = (df['position'] == -1) & (df['rsi'] > 70)
    df.loc[exit_short, 'signal'] = 1

    return df
Complete trading system integrating RSI calculation, pattern detection, and signal generation with exit rules.
Implementation Steps
- 1Calculate 14-period RSI using Wilder's smoothing method for accurate momentum measurement
- 2Identify significant peaks and troughs in RSI using signal processing techniques
- 3Scan for head-and-shoulders patterns within RSI oscillator values
- 4Validate patterns using quantitative criteria (head prominence, shoulder symmetry)
- 5Generate bearish reversal signals upon completion of head-and-shoulders pattern
- 6Enter short positions with appropriate position sizing based on pattern strength
- 7Set stop-loss above recent RSI peaks or price resistance levels
- 8Exit positions when RSI reaches oversold levels (<30) or shows bullish divergence
- 9Monitor for inverse head-and-shoulders patterns for bullish reversal signals
Key Metrics
Risk Considerations
Practice Implementation
Prerequisites
Mathematical Background
- • Linear regression and OLS estimation
- • Time series analysis (stationarity, unit roots)
- • Hypothesis testing and p-values
- • Basic econometrics (error correction models)
Technical Skills
- • Python programming (pandas, numpy)
- • Statistical libraries (statsmodels)
- • Data visualization (matplotlib)
- • Financial data handling (yfinance)
Complete Implementation
Access the full Python implementation from the original quantitative trading repository:
# Complete pair trading implementation
git clone https://github.com/je-suis-tm/quant-trading.git
cd quant-trading
python "Pair trading backtest.py"
# Modify tickers and parameters for your own analysis
Learning Checkpoints
Understand Cointegration
Can you explain why two assets might be cointegrated and what breaks this relationship?
Interpret Statistical Tests
Practice reading ADF test results and understanding when to accept/reject cointegration.
Signal Generation
Implement Z-score calculations and understand threshold selection (±1σ vs ±2σ).
Risk Management
Understand position sizing, monitoring regime changes, and exit strategies.
Recommended Learning Path
Immediate Actions
- Download and run the Python script
- Test with different asset pairs
- Experiment with threshold parameters
Advanced Studies
- Learn Johansen cointegration test
- Study Vector Error Correction Models
- Explore multiple asset pair trading
Important Disclaimer
This strategy involves significant risk. Historical cointegration relationships can break permanently. Always use proper risk management, position sizing, and never risk more than you can afford to lose. Paper trade extensively before using real capital.